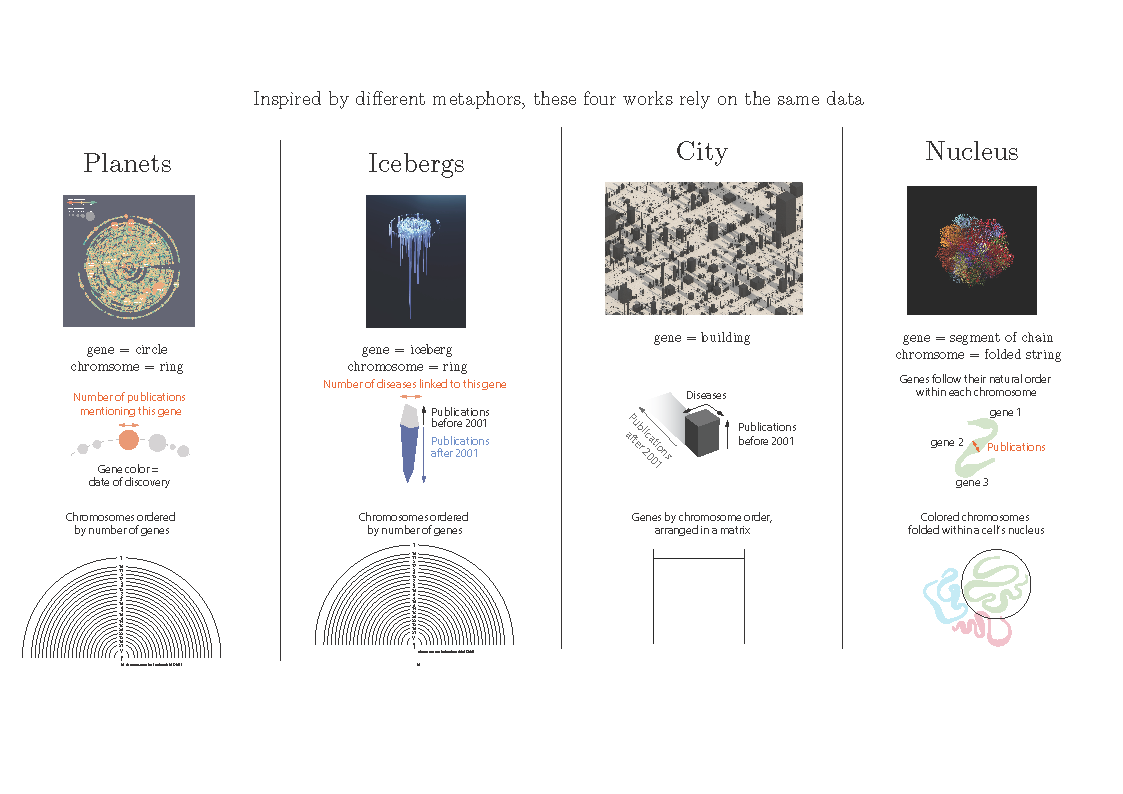
The BarabásiLab mapped out all scientific publications focusing on individual genes between 1900 and 2020. The cover image shows the human genome—the entire genetic information of a cell—by means of 25 rings. Each ring represents a human chromosome. On these rings, a total of 19,775 icebergs of various sizes correspond to individual genes. While the area above the imaginary water line of each iceberg measures the scientific interest in that gene preceding the HGP, the under-water depth shows the interest that followed the unveiling of the human genome. The width of the base of each iceberg captures the number of diseases associated with the gene.
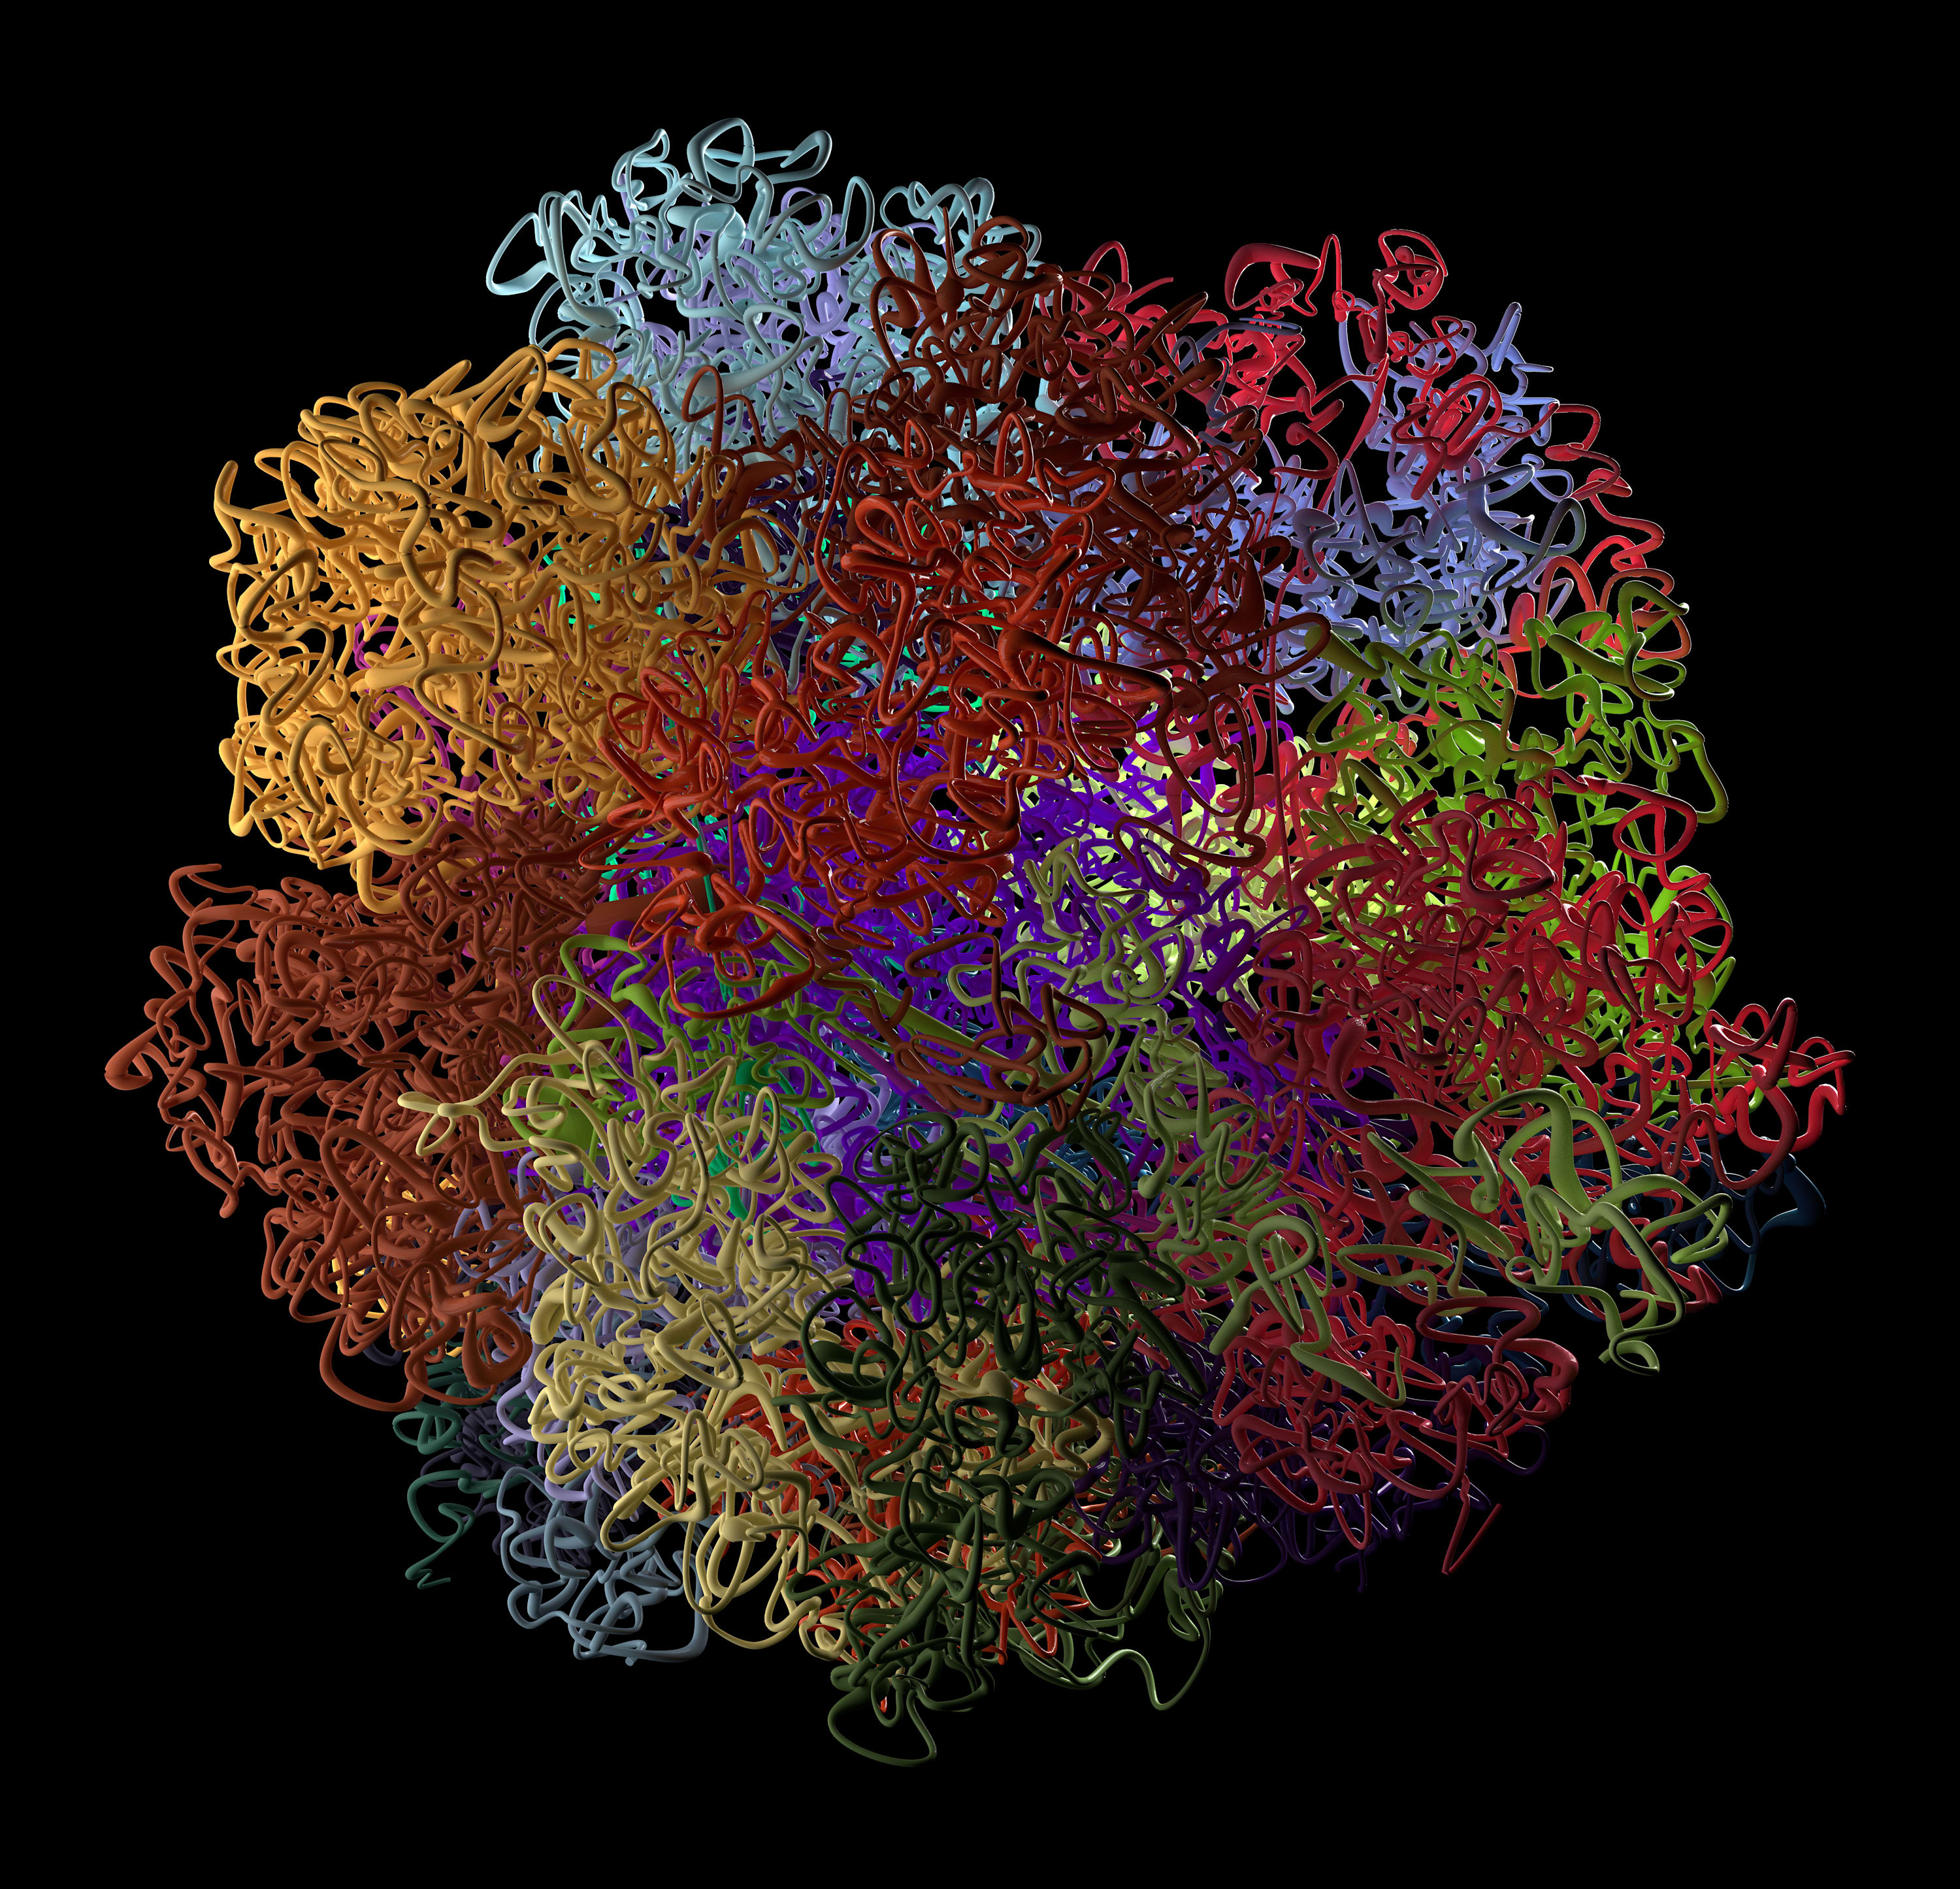
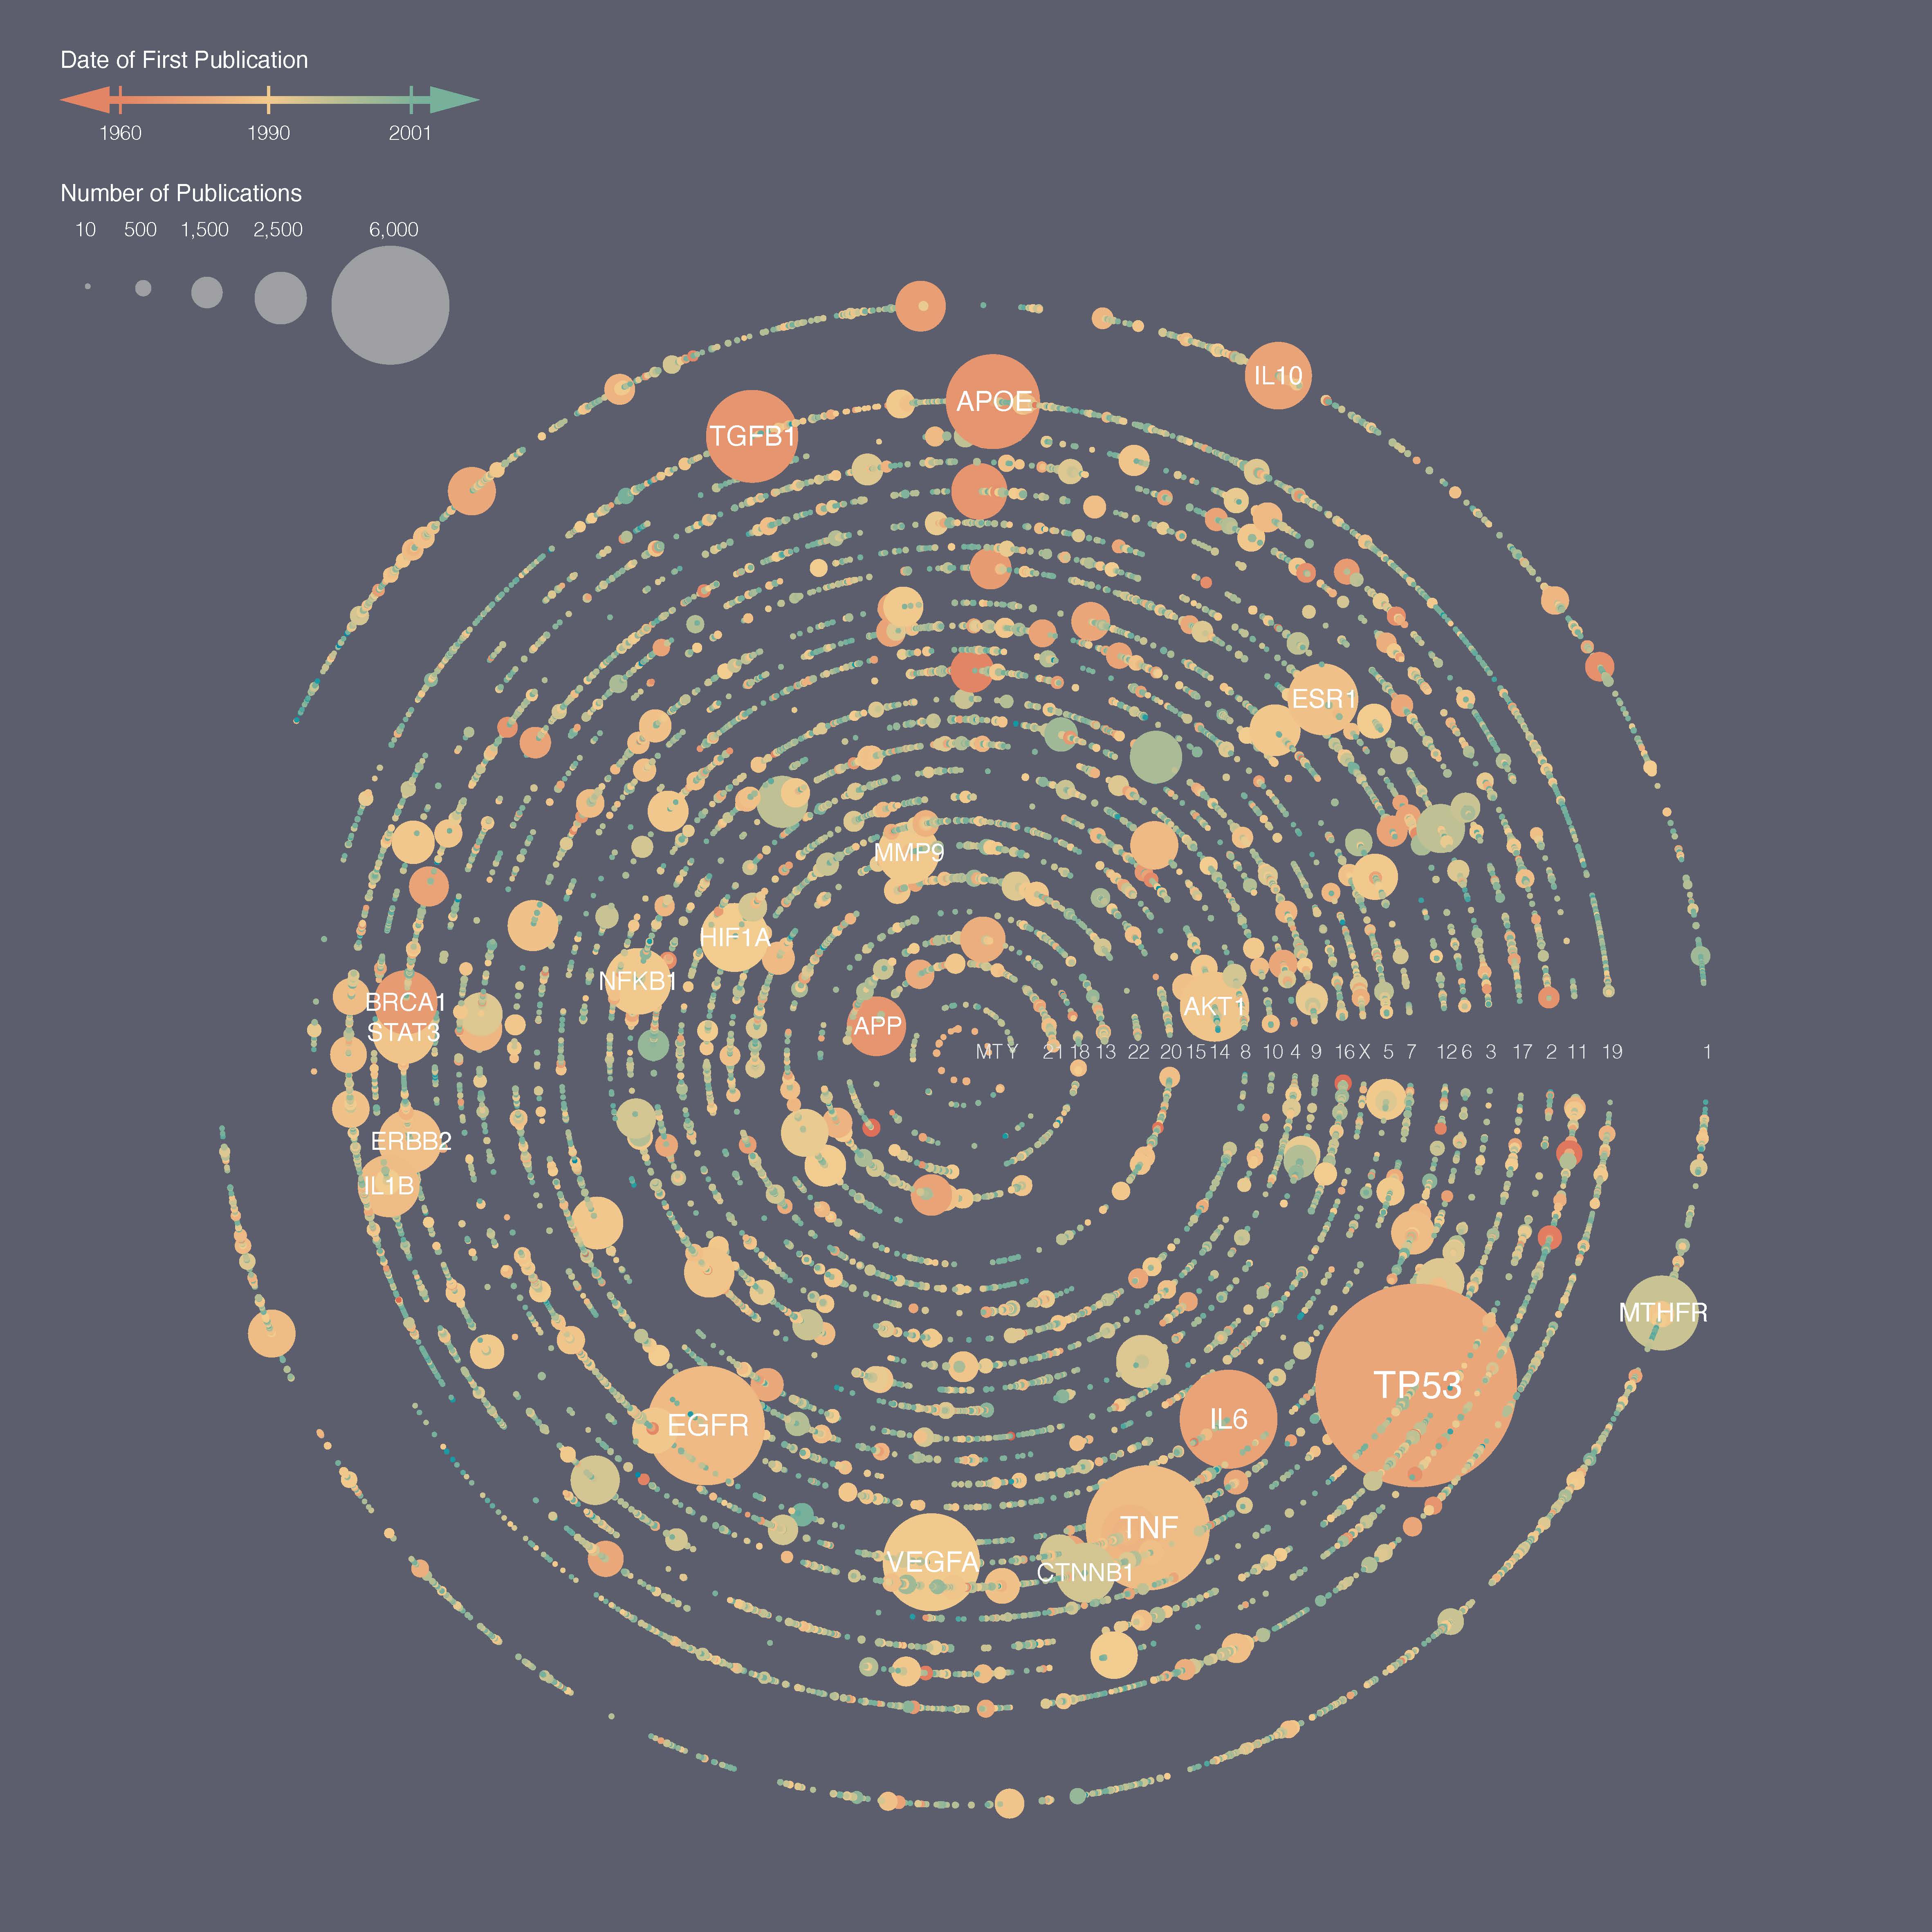
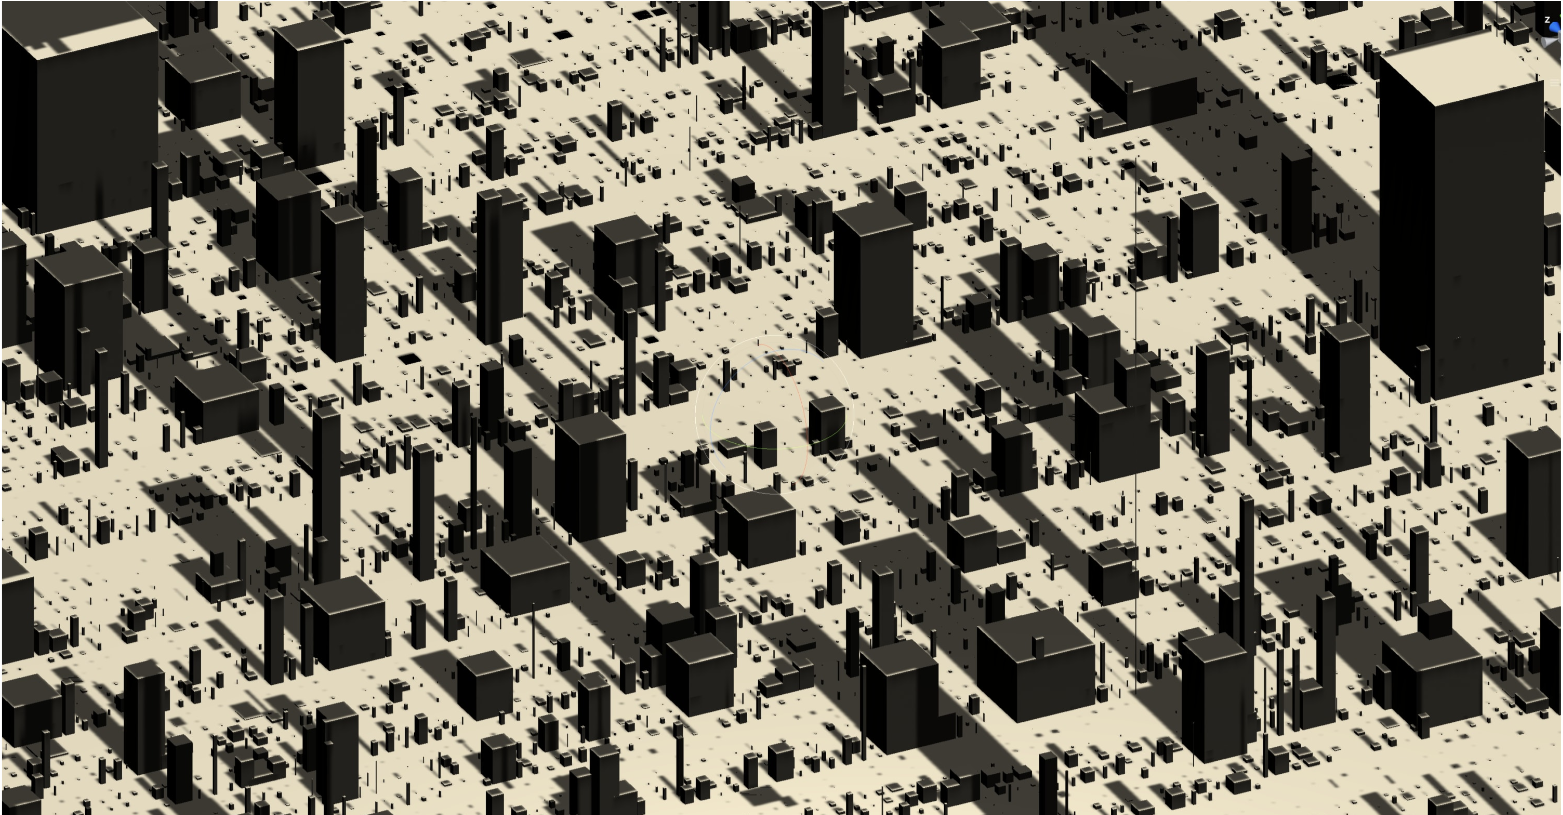
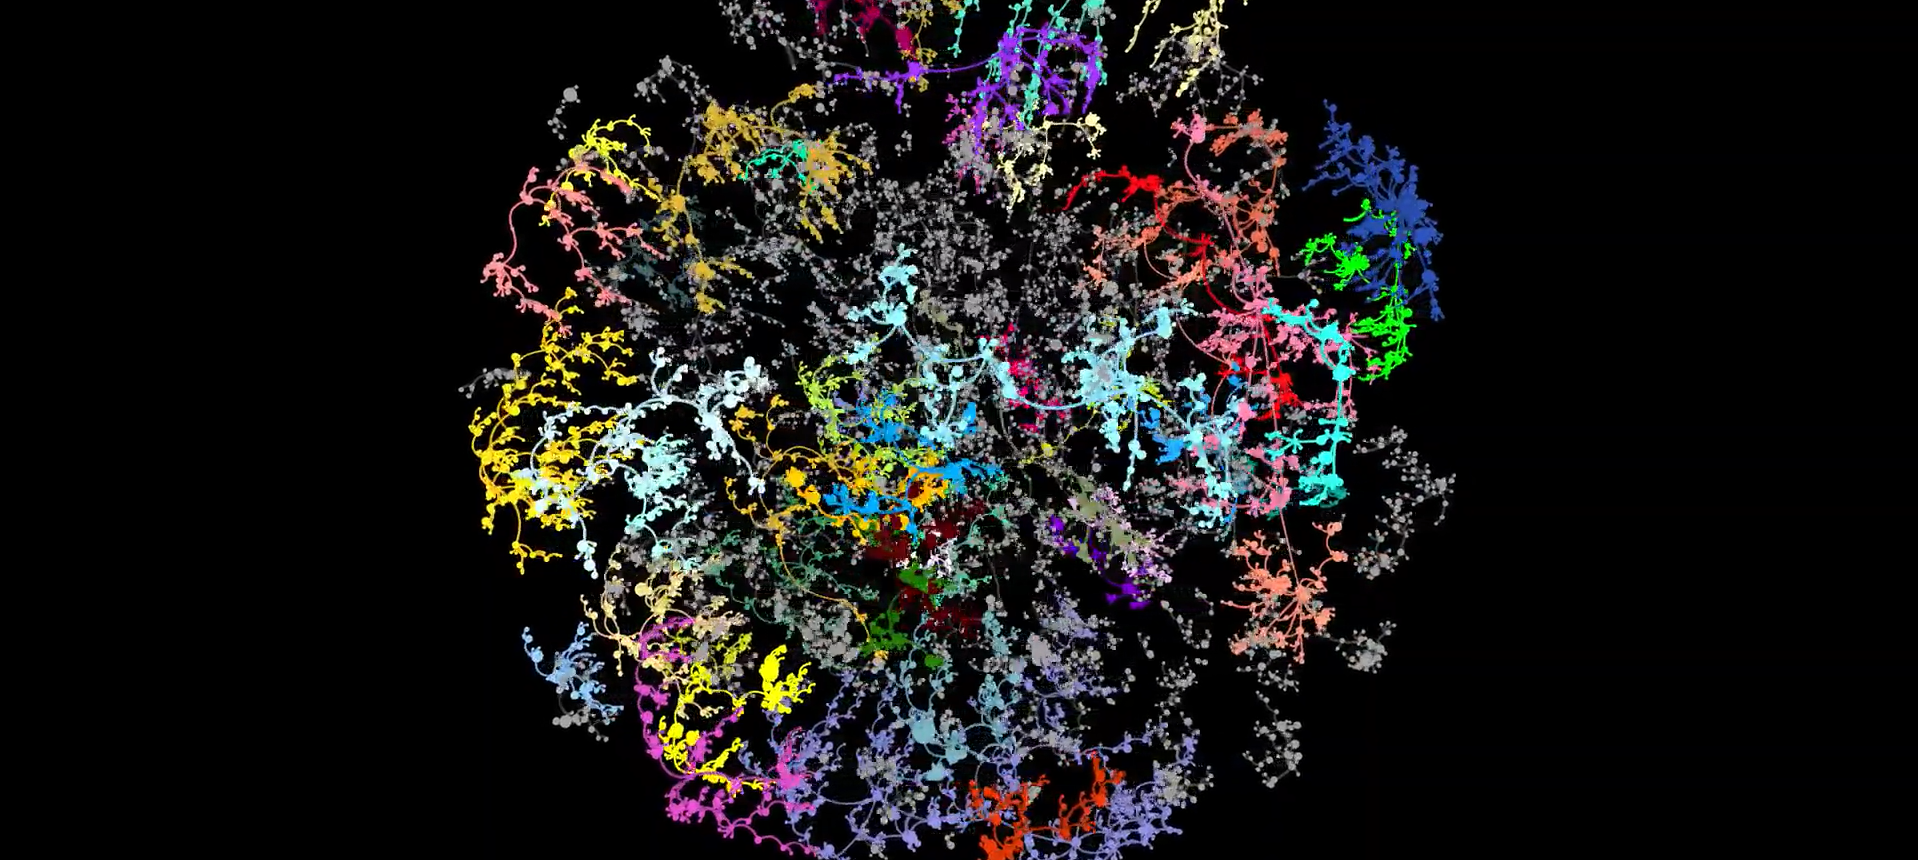
BarabásiLab has developed other representations of the same data in addition to the iceberg metaphor. For one, it built an imaginary Genetown. The other represents the genome as it crumples into a cell’s nucleus. The BarabásiLab visualizations illustrate the immense impact of the HGP on genetic research, which enables the study of the genetic roots of human diseases and drives the search for effective drugs. It also shows that many different visual solutions can represent the same dataset.







Contact
Social